Helping Designers Understand Code
My graduate research thesis focused on devising multidimensional visualizations of programming constructs to help designers and visual thinkers understand programming concepts.
August, 2015 - April, 2016
📄download full thesis document
Introduction
My graduate research work focused on designing interactive visualizations of programming constructs to help designers and visual thinkers understand programming concepts. My tool acts as a supplement to an introductory programming course for designers, and helps designers understand code by way of observation and interaction with these visualizations. This research is valuable because programming and computational thinking are very important skills for designers to have, but syntax based instruction of these skills has been proven to not be an effective way for designers to learn.
Not only does a visual way of representing programs make it easier to learn for visual thinkers, but visual thinking can be an extremely powerful way of thinking about computations. I strove to expose the state of a program over time, which can be very helpful for a programmer of any level understand what is happening in a program at any step of the program. I used several research methodologies and based my direction on learning theories to progress through the projec.
The visual nature of programming
Many of the core concepts in modern programming can be expressed visually, and have immediately accessible visual analogues. When a knowledgeable programmer imagines implementing a loop or an event, they can draw upon a mental visual representation. When they describe these concepts, they move their hands, they gesture, they draw. Even so, to professional programmers, many of these visual programming tools seem to be a limited shortcut, that are not capable of the full range of expression that textual programming provides and are seen only as intermediary tools on the way to learning how to “actually program”. This way of thinking can hold back new and powerful ways of thinking computationally. Visual programming is inherently attractive to people who think visually, but it should be attractive to anyone who programs and can “see”.
One of the major successes of Visual Programming Languages (VPLs) is the transformation of writing code into the act of play. The very quick iteration time and the ability to quickly debug various states of the program visually, almost immediately, is a strong opportunity that can be pushed further. This plays well with designers learning through discovery.
However, existing VPLs and programming tools don’t build transferable skills in the user. Since VPLs are primarily programming languages, the main focus is on making it easy for a user to write source code rather than learn computational thinking or programming concepts. For a tool that is being used in such a developmental stage of a user’s learning journey, it is very important for the user to learn the concepts, understand the nature and working of programming constructs as well. This is a transferrable skill that can be applied to any programming language in many paradigms. In the absence of such development, if the user wants or needs to use another programming language for a project, they might run into a wall and not know how to approach resolving a bug in the code or solve a problem.
An issue specific to data flow languages is the absence of time in the visualization of transient programming constructs. In many programming environments the state of an object throughout the computation changes, but this might not be reflected in the visual feedback to the user. Exposing state over time is a powerful way to teach many computational mental models and illustrate what a computation is actually doing, as opposed to just what its output is.
In this thesis, I explore how interactive three-dimensional transient visualizations of programming constructs may help in understanding the concepts behind programming in order to implement them in various programming paradigms and languages.
Framework and context
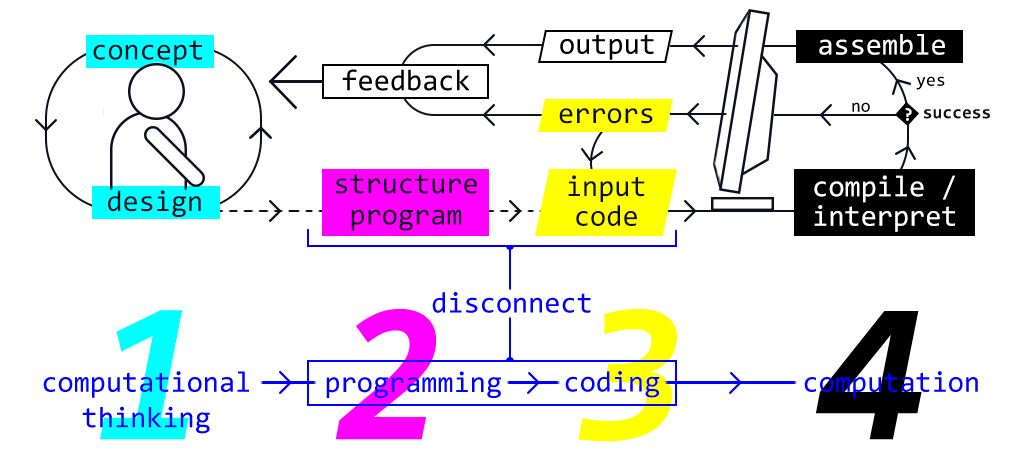
I propose that the process of writing a program involves four stages; computational thinking, programming, coding, and computation. I base this proposition on my experience serving as the teaching assistant for an introductory programming course for designers taught by Dr. Derek Ham.
My tool and the system of visualizations is designed for the context of an introductory programming course. In the classroom, the teacher introduces the students to different topics in programming, which the student can explore via my tool. Using my designed tool to explore various programming constructs, the student would go through the various phases in Kolb's experiential learning cycle, which I base my studies on.
I postulate that a visuo spatial approach to explaining the programming constructs is appropriate for design students based on Gardner's theory of multiple intelligences. My experience with design students tasked with learning programming affirms this decision.
Visual studies
An outcome of my investigations was the visualization of different programming constructs. I divide my process based on these visualizations, and talk about them in the following sections.
I use the freedom afforded by the digital visual medium to show the transient nature of various programming constructs. The visualizations are studies on different programming constructs, and are explorations into how they may be visualized such that they may be combined to form a bigger whole.
Variables
In programming, variables can have different data types, and can be either primitive or composite. I was more interested in visualizing the primitive data types. The primitive data types can be broadly classified into numerical, boolean, or character data types. These visualizations tackle the numerical variables more than the others, in part because of their broader application, and in part because of their more abstract nature.
I also look at ways to visualize things to introduce the concept of frame rates and computing power, and the relation between the two.

The second method works better in this regard since the value of a variable, positive or negative, may be judged from just the silhouette. Also see my VR Function Generator.

Infinite loop
Targeting visual thinkers and designers, I assumed a programming language which implemented an update function which is a recurring function, and can be thought of as an infinitely running loop. Tying this with the state of the program and the elements within, I introduce the idea of function calls changing the state of variables. This also situates the more abstract concept of a variable within a programming construct.
Exposing state over time is a powerful way to teach many computational mental models and illustrate what a computation is actually doing, as opposed to just what its output is.
The lines and arrows show the control flow.
Here, the student has full control over the visualization, be it state changes or spatial orientation.
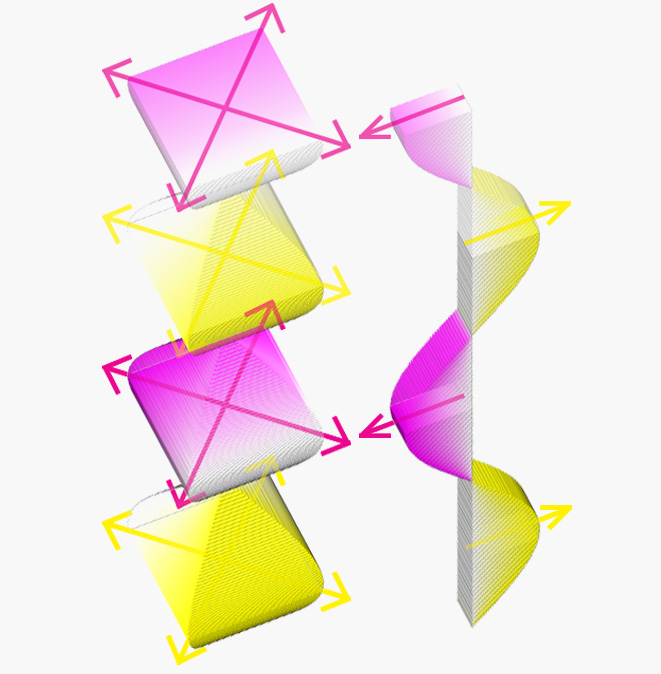
Conditional loop - for()
The for() loop can be seen as a combination of an infinite loop and a conditional statement. The for() loop is designed to run for a limited number of times, as long as a certain condition is met.
With this visualization, I introduce the code being visualized at the top for the student to see and manipulate. Manipulation of the code results in the structure of the visualized code changing. This adds a kinesthetic learning to the visual-spatial learning attribute.
The benefits of three dimensional visualizations for programming constructs is made more clear with a more complex construct like this one, as I show here.
The tool interface
I designed a tool that a student can use in the classroom context to explore various visualizations of programming constructs to help her understand the working behind them. I also prototyped it in Processing, and the low fidelity prototype is shown here.
The tool makes all the programming constructs being covered in class accessible to the student, as well as displaying several examples covering various topics. Details of interactions are shown in the screen captures.